


806 companies exported from Puy-de-Dôme in 2025.
That is a modest increase from 793 exporters in 2024, marking a return to growth after the previous year’s decline.
At first glance, the story appears straightforward: the number of companies engaged in international trade is increasing.
But the five-year data reveals something more interesting.
The export ecosystem is (slowly)growing while its internal structure is changing. Industry remains the largest sector, but it is no longer the main source of growth. Commerce is expanding faster in absolute terms, agriculture has recorded the strongest sustained growth among the major sectors, and the 2025 recovery was driven primarily by commerce and services.
The question is therefore no longer simply how many companies export.
It is increasingly about which sectors are creating new exporters and whether those exporters can remain active over time.
The headline: 806 exporters and a modest return to growth
Puy-de-Dôme counted 806 exporting companies in 2025, compared with 793 in 2024.
That represents annual growth of approximately 1.6%.
Over a longer period, the department’s exporter population has also expanded.
The number of exporters increased from 737 in 2014 to 806 in 2025, an increase of roughly 9% over eleven years.
The more recent five-year trend is more moderate.
Between 2020 and 2025, the number of exporters increased from 767 to 806.
That represents a 5-year CAGR of approximately 1.0%.
In other words, Puy-de-Dôme’s international business base is growing but gradually.
The more important story lies beneath the aggregate number.
Sector dynamics: five years of uneven growth
The export ecosystem has not evolved evenly.
Between 2020 and 2025, each major sector followed a different trajectory.
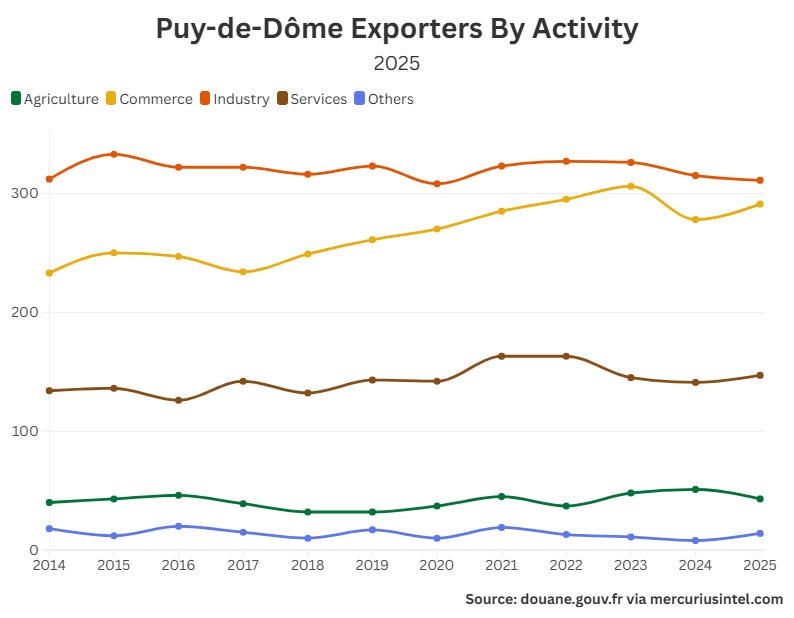
Industry remains the largest exporting sector, but commerce has been the main contributor to growth in the number of exporters over the last five years.
1. Industry remains the backbone but growth has stalled
Industry remains the largest sector in Puy-de-Dôme’s exporter population.
In 2025, 311 industrial companies exported, compared with 308 in 2020.
That is effectively flat growth over five years.
The resulting CAGR is just 0.2%.
The sector’s importance should therefore not be confused with dynamism.
Industry remains structurally dominant, but the number of industrial exporters has not expanded significantly.
In fact, the historical trend suggests a peak earlier in the period, followed by a gradual decline.
The number of industrial exporters reached 327 in 2022, before falling back to 311 in 2025.
This matters because industrial companies are traditionally at the core of territorial export ecosystems.
Puy-de-Dôme has maintained this industrial base but it is not currently generating significant growth in the number of new exporters.
2. Commerce is the main engine of exporter growth
Commerce is the sector that contributed the most to the expansion of Puy-de-Dôme’s exporter population.
The number of exporting companies increased from 270 in 2020 to 291 in 2025.
That represents:
+21 exporters
+7.8% over five years
A 1.5% CAGR
Commerce alone contributed more than half of the total net increase in exporters between 2020 and 2025.
Of the department’s 39 additional exporters over the period, 21 came from commerce.
The sector has also demonstrated a strong recovery in the latest year.
After declining from 306 exporters in 2023 to 278 in 2024, commerce rebounded to 291 exporters in 2025.
That is an annual increase of approximately 4.7%.
The implication is significant.
While industry remains the largest sector, commerce is increasingly responsible for the renewal and expansion of the export base.
3. Agriculture is small, but has the strongest sustained growth among the major sectors
Agriculture remains a relatively small component of Puy-de-Dôme’s exporter ecosystem.
However, its five-year growth rate is notable.
The number of agricultural exporters increased from 37 in 2020 to 43 in 2025.
That represents a 3.1% CAGR, the strongest sustained growth among the four major sectors.
The sector remains volatile in absolute terms.
It reached 51 exporters in 2024 before falling back to 43 in 2025.
This means agriculture should not be interpreted as a large-scale engine of exporter growth.
Instead, the data suggests a smaller but increasingly international segment of the local economy.
Its importance is strategic rather than numerical.
4. Services are growing slowly with signs of recovery
Services increased from 142 exporters in 2020 to 147 in 2025.
That corresponds to a 0.7% CAGR.
The trajectory has been less stable than the aggregate five-year number suggests.
The sector reached 163 exporters in both 2021 and 2022, before declining in subsequent years.
The increase to 147 exporters in 2025 represents a recovery, but the sector remains below its earlier peak.
The broader conclusion is that services are participating in the internationalisation of the local economy, but they have not yet become a major driver of exporter growth.
The composition of growth is changing
The five-year numbers reveal an important structural shift.
Between 2020 and 2025, Puy-de-Dôme gained 39 exporters.
The contribution of each major sector was:
Commerce: +21
Agriculture: +6
Services: +5
Industry: +3
This means that more than half of the net increase in exporters came from commerce.
Industry remains the largest sector.
But commerce is increasingly responsible for growth.
This distinction matters.
A territory can have a strong industrial export base while simultaneously experiencing growth in new exporter creation outside industry.
That appears to be what is happening in Puy-de-Dôme.
2025: a recovery led by commerce and services
The latest year reinforces the five-year trend.
Between 2024 and 2025:
SectorAnnual changeCommerce+4.7%Services+4.3%Industry−1.3%Agriculture−15.7%
The total exporter population increased because growth in commerce and services outweighed declines elsewhere.
This is perhaps the most important change in the 2025 data.
The recovery in the number of exporters was not driven by industry.
It was driven primarily by sectors outside the department’s traditional industrial core.
A dynamic ecosystem: companies are entering, but many are also leaving
The total number of exporters tells only part of the story.
The 2025 data shows significant movement into and out of international markets.
During the year:
232 companies entered exporting
219 companies exited
574 companies remained active from the previous year
409 companies qualified as regular exporters, meaning they had maintained export activity continuously over five years
The number of new exporters increased by approximately 23.4% compared with 2024.
At the same time, the number of companies maintaining export activity from one year to the next declined.
This suggests a highly dynamic ecosystem.
Companies continue to discover international markets.
But maintaining a long-term export presence remains more difficult.
The policy challenge is therefore not only to help companies start exporting.
It is also to help them continue exporting.
That distinction becomes particularly important when evaluating the success of export-support policies.
A high number of new exporters can look positive in the short term.
But sustainable internationalisation depends on conversion from:
new exporter → repeat exporter → regular exporter.
Geography: Europe remains central, but diversification is accelerating
Europe remains the foundation of Puy-de-Dôme’s export geography.
In 2025:
370 companies exported to the European Union
418 exported to non-EU Europe
The number of exporters targeting traditional European markets declined in the latest year.
By contrast, the strongest growth came from the Americas.
Between 2024 and 2025:
Americas: +10.5%
Africa: +1.3%
Asia: −0.8%
European Union: −6.0%
Non-EU Europe: −6.0%
The Americas therefore stand out as the most dynamic international destination group in 2025.
This does not mean Europe is becoming less important.
Europe remains central to the export ecosystem.
But the data suggests that the growth frontier for new international relationships may increasingly lie outside traditional European markets.
Germany remains the largest EU market
Germany is the leading European Union destination by export value.
Exports to Germany reached approximately €559 million, representing 26.8% of Puy-de-Dôme’s exports to the European Union.
Other major EU destinations included:
Spain: €293 million
Italy: €281 million
Netherlands: €201 million
Belgium: €177 million
Germany’s position confirms the continued importance of European industrial and commercial integration for Puy-de-Dôme exporters.
The United States is the leading non-EU market by value
Outside the European Union, the United States is the largest export market by value.
Exports reached approximately €370 million, representing 25.4% of exports to third countries.
The United Kingdom followed with approximately €240 million.
One particularly interesting feature of the data is the difference between market value and market breadth.
Switzerland was served by the largest number of exporters, with 312 companies active in the market.
However, export value to Switzerland approximately €136 million was considerably lower than export value to the United States.
This suggests that different international markets play different roles.
Some markets are dominated by large-value flows.
Others are accessible to a broader population of exporters.
That distinction is important when analysing the internationalisation of local businesses.
The strategic picture
The 2025 data points to a Puy-de-Dôme export ecosystem that is becoming more diversified.
Three conclusions stand out.
1. Industry remains essential but it is no longer the main growth engine
Industry remains the largest exporting sector.
However, its exporter population has been broadly flat over five years.
Future growth in the number of exporters is increasingly coming from outside the industrial sector.
2. Commerce is becoming the primary source of exporter growth
Commerce generated the largest absolute increase in exporters between 2020 and 2025.
It also led the recovery in 2025.
The sector is therefore playing an increasingly important role in expanding the department’s international business base.
3. The real challenge is exporter sustainability
Puy-de-Dôme has a significant number of companies entering international markets.
But the data also shows substantial exits.
The strategic objective should therefore go beyond increasing the number of first-time exporters.
The stronger objective is to increase the number of companies that become regular, long-term exporters.
The bottom line
Puy-de-Dôme’s export ecosystem is growing, but slowly.
The number of exporters reached 806 in 2025, up from 767 five years earlier.
Yet the sector dynamics reveal a changing structure.
Industry remains the backbone.
Commerce is driving most of the growth.
Agriculture is the fastest-growing major sector in percentage terms.
Services are recovering, but remain below their earlier peak.
And behind the aggregate numbers, the ecosystem remains highly dynamic: hundreds of companies enter and leave export markets every year.
The next phase of Puy-de-Dôme’s internationalisation will therefore not be defined simply by how many companies start exporting.
It will be defined by whether the growing population of new exporters can become sustainable, repeat participants in international markets.
806 exporters.
39 more than in 2020.
And a clear shift in where the growth is coming from.
Methodology: exporter counts are based on the annual French Customs operator statistics for companies headquartered in Puy-de-Dôme. Five-year CAGR is calculated between 2020 and 2025 using five annual growth periods. Sector analysis focuses on the evolution in the number of exporting operators, not export value.
Data source: https://lekiosque.finances.gouv.fr/site_fr/regions/region_operateur.asp